Crunch - How to manage jobs on Gearshift
Gearshift uses the Slurm Workload Manager
- If you are completely new to computing on Linux clusters, we recommend
- The online, free course designed by The Linux Foundation and promoted by Linus Torvalds himself: Introduction to Linux. It is available on edX, the online educational platform by MIT.
- The interactive Linux Survival website.
- If you are new to Slurm:
- Continue reading below for examples specific to how Slurm was configured for the Gearshift cluster.
- Visit the SchedMD website for the full Slurm documentation and the Slurm tutorials.
- If you have worked with other cluster managers like PBS, LSF or SGE before you can use the Slurm cheat sheet with comparison of Slurm commands to commands from those other cluster managers.
Getting an account and starting a session on a User Interface (UI) server
In order work with Slurm and mange jobs on the cluster you'll need a personal account and start a session on a User Interface (UI) server. If you are new, please:
- follow these instructions to request an account.
- follow these instructions to login using your account.
Data transfers and storage systems
Please make sure you are familiar with the various storage systems available to the cluster:
- some are for designed for High Performance (HP)
- while others are designed for High Availability (HA)
- yet others are designed for archiving data cheaply for the long term
Therefore some file systems come with automagic cleanup while others don't and some file systems come with backups while others don't. Failure to understand what data should go where will lead to massive data loss rather sooner than later, so before you start to create jobs to crunch data, please make sure you are familiar with the details of what is stored where on gearshift!
If the data you want to work with is not already available on the cluster, you will need to transfer data to the cluster, which is covered by instructions on a separate data transfers page.
Job types
Simple tasks that require little time, little computational power and little memory can be executed directly on a User Interface (UI) server. Please think twice though before you hit enter: if you crash the UI, others can no longer submit nor monitor their jobs, which is pretty annoying. The better option is to start a job on a compute node for which you request a certain amount of resources. Your job will then be restricted to that amount of requested resources and cannot crash a machine by depleting all resources. There are 2 kind of jobs:
- batch jobs a.k.a. non-interactive jobs
- interactive jobs
1. Batch jobs
For large data sets or long running commands you will need to create a (bash) job script, which can be submitted to the Slurm scheduler. When resources are available the scheduler will copy the job at the top of the queue to a compute node where the job script will run. For efficient scheduling the scheduler needs to know how much resources (CPU cores, memory, time, disk space, etc.) your jobs need, so it can determine how many jobs can run in parallel. Therefore you have to specify how much resources your jobs need when you submit them to the scheduler. When you underestimate resource requirements, the job will be killed as soon as it exceeds the requested resource limits. When you overestimate the resource requirements, resources will get wasted and you cannot run the optimal number of jobs in parallel. In addition smaller jobs may be able to bypass larger ones in the queue due to backfill scheduling, which will start lower priority jobs if doing so does not delay the expected start time of any higher priority jobs. Hence you will need to profile your workload using a few test jobs before scaling up.
To profile your jobs you should submit one or two test jobs first and monitor their resource usage. There are various commands to monitor jobs:
- Some can be used only on running jobs, others only on finished jobs.
- Some are default Slurm commands, others are custom tools we've developed and are part of the cluster-utils module.
Please consult the job profiling instructions for details. Once you've profiled your job scripts and are sure they will behave nice & perform well, you can start submitting larger batches.
Submitting batch jobs
Simple submit of job script with sbatch and using default Quality of Service (QoS):
sbatch myScript.sh
By default the name of your job will be the filename of the submitted script. To submit a job with a different name
sbatch --job-name=myJobName myScript.sh
Submitting a job with a dependency on a previously submitted job.
This job will not start before the dependencies with job IDs jobID1 and jobID2 have completed successfully:
sbatch --depend=afterok:jobID1:jobID2 myScript.sh
Instead of providing arguments to sbatch on the commandline, you can also add them using the #SBATCH syntax as a special type of comments to your job script like this:
#!/bin/bash
#SBATCH --job-name=jobName
#SBATCH --output=jobName.out
#SBATCH --error=jobName.err
#SBATCH --time=00:59:00
#SBATCH --cpus-per-task=1
#SBATCH --mem=4gb
#SBATCH --nodes=1
#SBATCH --open-mode=append
#SBATCH --export=NONE
#SBATCH --get-user-env=60L

[Your actual work...]
The #SBATCH comment lines must start with #SBATCH. Hence any white space in front of #SBATCH will prevent sbatch from interpreting the resource requests.
Commonly used options:
--job-name=jobName- Set the job name
--nodes=1- Requests 1 node.
- Please note that the Gearshift cluster does not use high bandwidth + low latency (Infiniband) network between compute nodes.
Therefore it does not make sense to distribute a job over multiple nodes and the only accepted value for
--nodeson Gearshift is1.
--cpus-per-task=X- Requests X CPUs (cores) for your job.
--mem=Xgb- Requests X GB RAM total per job
--tmp=Xgb- Requests X GB of local scratch disk space total per job
--time=hh:mm:ss- Sets the work allocation time a.k.a. walltime to the specified value in hours:minutes:seconds.
--constraint=tmp01- Request a node with a specific feature label/tag; in this example a specific shared storage system named
tmp01.
- Request a node with a specific feature label/tag; in this example a specific shared storage system named
--output=outputLog.out- Redirects the standard output to the desired file. Note that using '~' in the path for your home directory does not work.
- Note that the standard output is buffered and first written on the local node where the job is running. It is copied to the specified location once the job terminates (regardless of the reason of the job termination).
--error=errorLog.err- Redirects the error output to the desired file. Note that using '~' in the path for you home directory does not work.
- Note that the error output is is buffered and first written on the local node where the job is running. It is copied to the specified location once the job terminates (regardless of the reason of the job termination).
--get-user-env=60L- Replicate the Login environment (and overrule whatever environment settings were present at job submission time).
- The number before the L is the time-out in seconds for replicating the login environment. The default is only 8 seconds, which may be too short when config files need to be sourced (from a home dir) and the storage system on which they reside is temporarily slow due to high load.
--export=NONE- Do not export environment variables present at job submission time to the job's environment. (Use a clean environment with --get-user-env=L60 instead!)
The batch job's environment
We highly recommend using the two sbatch options
#SBATCH --export=NONE
#SBATCH --get-user-env=60L
in combination with
module load someSoftware/someVersion
module load otherSoftware/otherVersion
module list
statements in your job script to ensure a clean job environment and reproducible scripts.
Hence any manual changes to your shell's environment at job submission time (and which are not specified in the job script) should not impact your job's result.
The module list after any module load commands ensures you log all explicit as well as all implicit dependencies in the *.out file that is created for each job.
Checking the status of running batch jobs
Getting a list of queued and running jobs of all users using squeue and with default output format:
squeue
Same with custom output format:
squeue -o "%i|%q|%j|%u|%C|%m|%d|%l|%T|%M|%R|%Q" | column -t -s "|"
If you like the custom output format above, but cannot remember to format string, you can use the cqueue wrapper from the cluster-utils module:
module load cluster-utils
module list
cqueue
Limit output to your own jobs:
squeue -u [your account]
Our cqueue with custom output format accepts the same commandline options, so this will also work:
module load cluster-utils
module list
cqueue -u [your account]
Get full output for a specific job (you probably don't want that for all jobs....):
squeue -j [jobID]
To get more detailed info about consumed resources for a running job you need the sstat command.
NOTE: for sstat you must append a .batch suffix to your job IDs:
sstat -j [jobID].batch
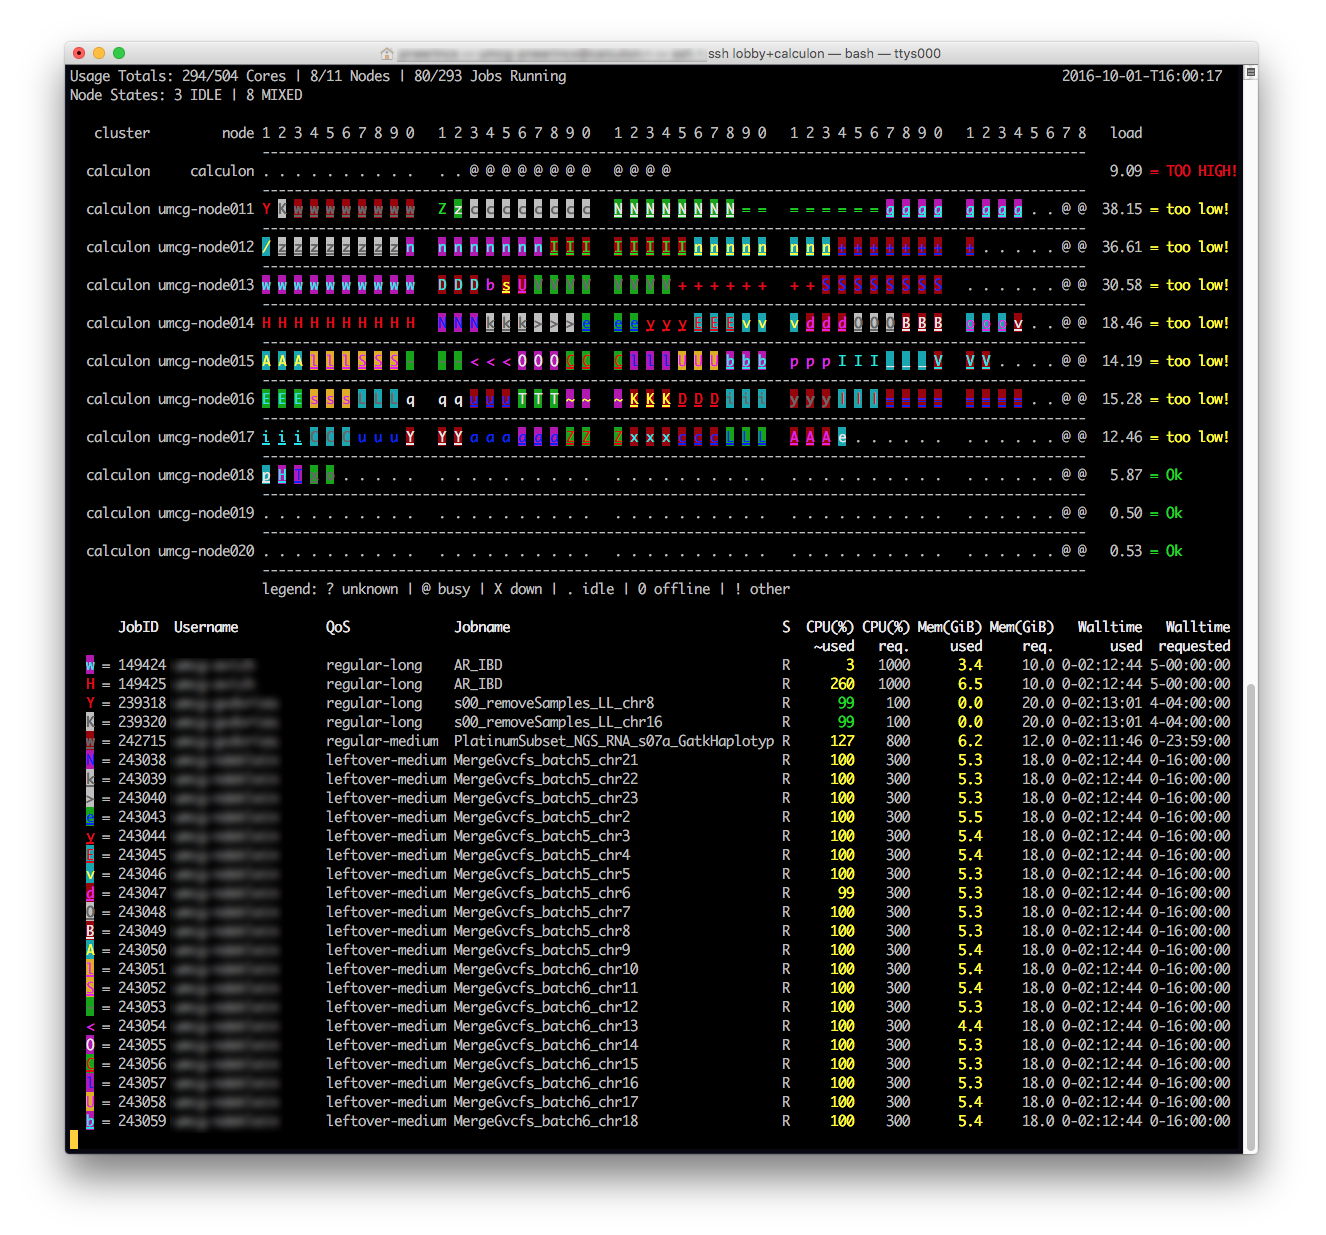
We have a custom cluster top tool or ctop for short to get a complete picture of the status of your running jobs as well as the cluster as a whole.
This tool integrates data from multiple Slurm tools and commands in single ncurses-based view on the commandline.
ctop is part of a collection of custom cluster-utils.
module load cluster-utils
module list
ctop
Checking the status of finished jobs
The squeue and sstat commands do not list jobs that already finished. Stats for those jobs can be retrieved from the Slurm accounting database with the sacct command.
To get job stats for your own jobs that for example started after 2015-09-14T11:00:00 and finished before 2015-09-14T11:59:59:
sacct -S 2015-09-14T11:00:00 -E 2015-09-14T11:59:59
Get job stats for a specific job:
sacct -j [jobID]
In addition to the default Slurm sacct command our cluster-utils module provides more convenient output using the sjeff (Slurm Job EFFiciency) command:
sjeff -j [jobID]
The sjeff command can also be used to create overviews and summaries of large numbers of jobs and compute the used resources as percentage of what was requested.
Deleting jobs
The scancel command aborts a job removing it from the queue or killing the job's processes if it already started:
scancel [jobID]
Deleting all your jobs in one go:
scancel -u [your account]
2. Interactive jobs
When you need to interact with a running job you can start an interactive session with the srun command.
This creates a shell on a compute node, which works the same as a shell on the User Interface except that the shell is restricted to the requested resources.
This is ideal for debugging/testing and prevents your work from running out of control, crashing processes from other users or vice versa.
Just like for the sbatch command for batch jobs you will need to request resources like amount of cores, amount of memory, work allocation time (walltime), etc. for interactive jobs too.
E.g. to request a session for one hour:
srun --cpus-per-task=1 --mem=1gb --nodes=1 --qos=interactive --time=01:00:00 --pty bash -i
When the requested resources are available the interactive session will start immediately.
To increase the chance your interactive session will start quickly, even when the cluster is relatively busy, you can request Quality of Service level interactive with --qos=interactive.
Essential: the order of srun arguments is not important except that --pty bash -i must be last.
Any options after --pty bash are interpreted as arguments for the requested shell and not for the srun command.
Hence the -i in the example is an argument for the bash shell.
When you exit the bash shell using either the exit command or by pressing CTRL+d the interactive job will be cancelled automagically and the corresponding resources released.
Job priority and scheduling efficiency
When it's busy and not enough resources are available to process all jobs simultaneously, some will have to wait in the queue. Which job will be started next is determined based on
- Job priority
- Backfill to improve scheduling efficiency
- Whether a job in the queue can preempt a running job or not.
Job priority
Job priority is a relative weight and a combination of:
- Quality of Service (QoS): a higher priority QoS has more weight than a lower priority one.
- Fair Share: Recent historic resource usage impacts your fair share; The more resources you used recently, the lower your fair share weight.
- Accrued Queue Time: the longer a job has been waiting in the queue, the higher the weight.
Backfill
To improve scheduling efficiency Slurm may use backfill to start a lower priority job before a higher priority one if it does not delay the higher priority job.

In this example the 2 small 1 core for 1 hour jobs had the lowest priority, but with backfill, Slurm will start them before the higher priority 5 core for 1 hour job, which has to wait for enough resources to become available.
Please note that this is a simplified example taking only cores and time into account. In real life Slurm is playing sort of a multidimensional Tetris game taking other resources like memory into account too.
Job preemption
Preemption means that a job in the queue can get resources by pushing another running job out of its way. For the running job that gets preempted this means it will get killed and automatically rescheduled. Unless the rescheduled job can use a smart form of check pointing to resume from where it got interrupted, this means it will have to start all over from scratch and any resources it used up to the point it got killed & rescheduled were wasted. Therefore preemption of short jobs can help to free up resources for high priority jobs on a busy cluster without wasting a lot, but for long running jobs it is less suitable, because the longer the walltime, the higher the chance it gets preempted and hence the more resources got wasted.
Quality of Service
We use 6 Quality of Service (QoS) levels with 3 QoS sub-levels each. The QoS sub-levels are automagically determined by the system to differentiate between short versus medium versus long running jobs and enforce limits on resources available to the latter to prevent long running jobs from hogging the complete cluster. The base QoS levels are determined by the users and these allow you to differentiate between:
- jobs with lower versus higher priority
- high performance computing versus data staging jobs
- batch jobs versus interactive jobs

Without different QoS levels for low vs. high priority jobs, all jobs from the same user would get scheduled in job submission order: first in = first out a.k.a fifo. But sometimes you need the result of a later submitted job more urgently than the results of an earlier submitted job. By specifying a QoS level with higher priority you can request Slurm to re-order the queue as shown in the picture above.
QoS levels
| QoS | Priority | Usage Factor | Available Resources | Shared Storage | Preemptable Jobs |
|---|---|---|---|---|---|
| leftover | 0 | none | Lots, up to the whole cluster for short jobs. | tmp only | Yes |
| regular | default | default | Quite some, but never the whole cluster. | tmp only | Only short jobs |
| priority | default x 2 | default x 2 | Just a few, max ~ 25 percent of the cluster. | tmp only | No |
| panic mode | default x 2 | default x 2 | Occasionally: Just a few. | tmp only | No |
| interactive | default x 3 | default | Minimal: max 1 job per user. | tmp only | No |
| ds | default | default | Minimal: max 1 core + 1GB mem per job. | tmp and prm | No |
Recent jobs determine your fair share weight when calculating job priority: The more resources you recently consumed the lower your priority for new jobs. The usage factor determines the impact of your recent jobs on your fair share. This impact decays exponentially over time, so the older the job the less impact and after a few weeks those old jobs no longer impact your fair share weight at all. Remember that job priority is a combination of:
- QoS weight
- Fair Share (recent historic usage) weight and
- Accrued queue time weight.
So if you recently consumed a massive amount of resources, your Fair Share based weight may be very low
and - despite requesting QoS level priority - jobs of other users may have higher combined prio than yours.
Hence your priority jobs will start before your own regular jobs, which will start before your own leftover jobs,
but not necessarily before jobs of other users...
Moreover, the total amount of resources available to a higher priority QoS level may be lower than the total amount of resources available to a lower priority QoS level. This is to make sure users don't submit simply everything as priority job, which would defeat the whole purpose of having different QoS levels. When the total amount of resources available to a higher priority QoS level is already in use and there are unused resources available for a lower priority QoS level, then jobs with that lower priority QoS level may start before the ones in the higher priority QoS level.
1. QoS leftover
You are a cheapskate and decided to go Dutch.
You'll consume whatever resources are leftover and will accept lowest priority for your jobs.
The usage factor is zero, so any resources consumed using this QoS level will not impact your fair share,
which is used for calculating job priority.
Jobs from all other QoS levels can preempt jobs in QoS level leftover.
It may take some time for this research project to complete, but hey you got it for free!
2. QoS regular
No goofy exceptions; this is the default when no QoS level is requested explicitly.
Running with this QoS level will process jobs with standard priority and count for your fair share accordingly.
Medium and long running jobs cannot get preempted: once started, they will be allowed to finish
no matter how busy the cluster is. Short jobs may get preempted, but only by jobs in QoS interactive.
3. QoS priority
You are working on multiple projects simultaneously and have a lot of jobs in the queue already,
but are eager to get the results for jobs submitted with this QoS level first.
The total amount of resources available to this QoS level is limited and
your fair share factor is charged double the amount of (normalised) resources as compared to when using QoS regular,
so choose wisely what you submit with QoS level priority.
Jobs cannot get preempted by others: once started, they will be allowed to finish.
4. QoS panic mode
You had to submit your PhD thesis or conference abstract yesterday, ooops.
We know how science works and planning can be hard when you expect the unexpected,
so we will try to accommodate your request for QoS level panic mode,
but as this is kind of disruptive for others who try to schedule their "science as usual",
the following rules apply:
- You cannot submit jobs with QoS level
panic modeyourself.
Instead you submit your jobs with QoS levelpriorityand contact an admin, who will manually bump the priority of your jobs to move them to the front of the queue. - Your fair share factor will be impacted as if the jobs were submitted with QoS level
priorityand to make surepanic modedoes not become Standard Operating Procedure (SOP) you will have to buy the admins a round of drinks, pie, ice cream, or ... depending on season or whatever the next social event will be. - If a next request for QoS level
panic modecomes too soon after a previous one (based on non-negotiable judgment by our boss), you will have to buy our entire department (~250 people) a round of drinks, pie, ice cream, or ... depending on season or whatever the next social event will be. - If the latter did not help to reduce the frequency of requests for QoS level
panic mode, we will send your PI, alpha (fe)male or promotor a bill to buy additional cluster nodes, storage servers, network switches or whatever resource is in most demand. Using these additional resources we can then either increase the capacity to process jobs faster using QoS levelregularor create a dedicated QoS level with increased fair share ratio depending on investment. (minimal investment 10K euro)
5. QoS interactive
A dedicated QoS level for interactive jobs. These jobs will get super mega hyper priority as staring at a terminal waiting for a session to start isn't fun.
You can have only one job in QoS interactive otherwise it would not be interactive anymore.
There is no medium nor long QoS sub-level for interactive jobs:
if you need more than 6 hours it is either no longer interactive work or it is not healthy and you need to get yourself a break!
Jobs in QoS interactive-short cannot get preempted themselves and can preempt jobs in QoS regular-short & leftover.
Interactive jobs will have a bash ${TMOUT} environment variable set to 30 minutes, so you can get a quick coffee break,
but do not try to keep in-active interactive sessions alive by running silly programs that waste CPU cycles:
Logout if you go to a meeting and start a new interactive job when you get back instead.
Wasting more than 30 minutes worth of resources in this QoS may lead to a temporary ban.
6. QoS ds
QoS dedicated for data staging and the only one where jobs can access both tmp as well as prm shared storage systems.
To prevent abuse jobs can only use a single core and 1 GB memory max,
which should be plenty to copy or rsync data from one storage system to another,
but does not allow for high performance computing.
QoS sub-levels
The 3 Quality of Service sub-levels:
- short for jobs that require < 06:00:00 walltime (6 hours)
- medium for jobs that require < 1-00:00:00 walltime (1 day)
- long for jobs that require < 7-00:00:00 walltime (7 days = max)
The QoS sub-level is automagically determined based on the requested walltime for a job. You should not request a QoS sub-level explicitly; If you do, the job will be reset to the corresponding QoS level and the QoS sub-level will be re-assigned based on the requested walltime.
The medium and long QoS sub-levels have less resources available to prevent long running jobs from hogging the complete cluster.
Otherwise priority jobs could be sitting at the top of the queue for days waiting for a slot to become available.
Hence when it's not busy you can consume all resources available on all nodes with jobs in QoS level leftover-short,
but you can consume only a very limited amount of resources in QoS-level priority-long.
So if you submitted a lot with QoS priority and a long walltime, those jobs may still be queued even if there are nodes sitting idle.
Requesting QoS
You can request a specific QoS on the commandline using the --qos=level argument like for example:
sbatch --qos=priority myScript.sh
or use an #SBATCH comment in the header of your script like for example:
#SBATCH --qos=leftover
QoS level and sub-level details
For the complete picture and limits use the following command:
sacctmgr show qos format=Name%15,Priority,UsageFactor,GrpTRES%30,GrpSubmit,MaxTRESPerUser%30,MaxSubmitJobsPerUser,Preempt%45,MaxWallDurationPerJob
Cannot remember the custom format string above? Try cqos from our cluster-utils module:
module load cluster-utils
module list
cqos
Nodes and Partitions
Amount and types of resources (CPUs, Memory, storage, etc.) varies from one cluster to the next. See the specifications page for an overview. To get an overview of the nodes and see how they are doing from the commandline, login to a cluster UI and execute:
sinfo -o "%P|%a|%D|%T|%z|%c|%B|%m|%d|%f|%g|%l|%s|%S|%N|%E" | column -t -s "|"
Cannot remember the custom format string above? Try cnodes from our cluster-utils module:
module load cluster-utils
module list
cnodes
Partitions are used by Slurm and admins to group nodes with an identical config, but as a user you are on a need to know basis... and you don't need to know, so forget about partitions. You do not need to specify a partition for your jobs as they will be automagically routed to all available partitions and get a suitable node assigned based on the requested QoS. In fact if you do specify a partition it will be removed automagically from your job submission request before assigning the job to all available partitions.
Storage
Shared storage
We use various shared storage systems with quota. Some are optimized for High Performance (HP) while others are optimized for High Availability (HA). To make optimal use of the available storage please consult the storage page. Note that High Performance (HP) for shared storage systems means high bandwidth, but not low latency. If your workload results in serial or streaming IO patterns your jobs can read or write directly from the shared storage systems. If your workload on the other hand results in random IO patterns, you should consider using local scratch space on a cluster node instead.
To get the status of quota limits for groups and filesystems your account has access to you can use:
module load cluster-utils
quota
Shared storage systems available on a node are listed as node features, which can be requested as a resources of the type constraint when submitting jobs with sbatch.
You can request a node with a specific shared storage system on the commandline using the --constraint=filesystem argument like for example:
sbatch --constraint=tmp01 myScript.sh
Alternatively you can use an #SBATCH comment in the header of your script and request a node with access to multiple file systems like for example:
#SBATCH --constraint="tmp01&prm01"
Note that when specifying multiple features they must be joined with an ampersand and the list must be quoted.
For the complete picture and which tmp filesystems are available on which nodes look for the FEATURES column in:
module load cluster-utils
module list
cnodes
Local scratch space on a cluster node
Local scratch disks on compute nodes have a lot less capacity than large shared file systems and may have less bandwidth too, but feature lower latency as the data does not have to travel over network to a compute node. This makes local scratch space the preferred type of storage for workloads that result in random IO patterns.
If you want to use local disk space on a node instead of or in addition to the shared storage, you need to request local disk space either on the commandline when submitting your job like this:
sbatch --tmp=4gb myScript.sh
or in the header of your job script like this:
#!/bin/bash
#SBATCH --tmp=4gb
A private temporary folder will be created for your job, which will be removed instantly once your script has finished. You can access this folder in your job script using this environment variable:
${TMPDIR}
Please make sure you do not use more disk space then requested.
Jobs consuming local scratch space outside their ${TMPDIR} will be deleted without notice as they interfere with scheduling.
Debugging and Frequent Asked Questions (FAQs)
Q: How do I know what environment is available to my job on an execution host?
A: The environment available to your jobs on execution hosts is similar but not necessarily exactly identical to the one you see on a User Interface (UI). In order to see what your environment looks like for your jobs you can submit a simple test job script like this one:
#!/bin/bash
#SBATCH --job-name=CheckEnvironment
#SBATCH --output=CheckEnvironment-%N-%u-%j.out
#SBATCH --error=CheckEnvironment-%N-%u-%j.err
#SBATCH --time=00:05:01
#SBATCH --cpus-per-task=1
#SBATCH --mem-per-cpu=1gb
#SBATCH --nodes=1
#SBATCH --open-mode=truncate
#SBATCH --export=NONE
#SBATCH --get-user-env=60L

set -e
set -u

echo '=========================================================================='
echo 'Complete job environment:'
echo '--------------------------------------------------------------------------'
printenv
echo '=========================================================================='
echo '#'
echo '##'
echo '#'
echo '=========================================================================='
echo 'Module system version:'
echo '--------------------------------------------------------------------------'
module --version 2>&1
echo '=========================================================================='
echo '#'
echo '##'
echo '#'
echo '=========================================================================='
echo 'Available and loaded modules:'
echo '--------------------------------------------------------------------------'
module av
echo '--------------------------------------------------------------------------'
module list 2>&1
echo '=========================================================================='
echo '#'
echo '##'
echo '#'
echo '=========================================================================='
echo 'Try to load cluster-utils module:'
echo '--------------------------------------------------------------------------'
echo 'Loading cluster-utils module ... '
module load cluster-utils
echo '--------------------------------------------------------------------------'
module list
echo '=========================================================================='
echo '#'
echo '##'
echo '#'
echo '=========================================================================='
echo 'Checking local scratch dir ${TMPDIR} for job ${SLURM_JOB_ID}:'
echo '--------------------------------------------------------------------------'
echo -n "TMPDIR for job ${SLURM_JOB_ID} is: "
cd "${TMPDIR:-}"
pwd
echo '--------------------------------------------------------------------------'
echo 'TMPDIR contains:'
ls -ahl "${TMPDIR:-}"
echo '=========================================================================='
echo '#'
echo '##'
echo '#'
echo '=========================================================================='
echo 'Checking if swap space is defined on this host:'
echo '--------------------------------------------------------------------------'
if [[ $(free | grep -i Swap | awk '{print $2}') -eq 0 ]]; then
    echo "ERROR: $(hostname) lacks swap space."
    exit 1
else
    echo "INFO: $(hostname) has swap space ($(free -m | grep -i Swap | awk '{print $2}') MB)."
fi
echo '=========================================================================='
echo '#'
echo '##'
echo '#'
echo '=========================================================================='
echo -n 'Generating some CPU load, so it will popup in job stats ...'
seconds=10
endtime=$(($(date +%s) + ${seconds}))
while [ $(date +%s) -lt ${endtime} ]; do
    echo '.'
    head -10000000 /dev/urandom | md5sum > /dev/null
done
echo '=========================================================================='

touch ${SLURM_SUBMIT_DIR}/checkENV-${SLURMD_NODENAME}-${SLURM_JOB_USER}-${SLURM_JOB_ID}.finished
To submit this script to a specific node like for example gs-vcompute01 and with QoS priority for quick debugging:
sbatch --nodelist=gs-vcompute01 --qos=priority CheckEnvironment.sh
This script can be supplemented with for example ls and df commands to see if certain paths exist, what their permissions are and which filesystems are mounted.
The output is logged to a file named ${SLURM_SUBMIT_DIR}/CheckEnvironment-%N-%u-%j.out, where
%N= the name of the compute node on which the job ran%u= the user who submitted the job%j= the JobID assigned by Slurm.
Q: I don't get any output; What is wrong?
A: If you don't get any *.out nor *.err file with the standard output or standard error streams of your jobs, then there is something wrong with the path in which you try to save these files.
Possible causes:
- Wrong permissions: You don't have permission to write in the location where you try to save these files.
- Wrong path: You have a typo in the path for the location where you try to save these files.
- Disk quota exceeded: You or the group you are a member of ran out of disk space and you cannot write anymore.
See the storage page for details on quota limits and how to check your quota status. - Filesystem not available: The filesystem on which you try to save these files does not exist.
This can either be by design of because of technical problems/downtime. Submit a job to check the environment on execution hosts (see example above), so you can see exactly what resources are available to your jobs.
Q: How can I profile my jobs?
A: Please use a the following 3 step procedure:
- Analyse a small subset of your data either by submitting a batch job script or by starting an interactive job and executing a command in that session. Use the tools mentioned below to monitor the resource usage of your test job.
- If you have rough estimates of the resources your jobs will need, you can submit a few test jobs for a larger chunk of data.
- Scale up and submit your final workload.
Tools for monitoring jobs
- For running batch jobs you can use
ctopfrom the cluster-utils module to monitor CPU and memory usage.module load cluster-utils module list ctop
You can also use the use the regular Slurm sstat command.
* For finished batch jobs you can use sjeff from the cluster-utils module to compare CPU and memory usage to what was requested.
E.g. for a single job:
    module load cluster-utils
    module list
    sjeff -j [JobID]
Or for an overview of resource usage of all Slurm jobs that wrote a *.out file to the same dircectory:
    module load cluster-utils
    module list
    sjeff -o /path/to/directory/
You can also use the use the regular Slurm sacct command.
* For running processes in an interactive session you can use the regular Linux tools like for example ps and top to monitor resource usage.
The cluster-utils module also has an improved version of htop, which you may want to try as opposed to regular the top:
    module load cluster-utils
    module list
    htop
Q: Why are my Java jobs misbehaving and using more cores than specified?
A: Tools written in Java sometimes use multiple cores. Usually they will allow you to specify how many threads/cores to use.
To your surprise you may see your jobs use more cores than you specified.
This happens because your Java application runs in a Java Virtual Machine (JVM) and the JVM itself also consumes resources.
Recent versions of Java use an efficient garbage collection (GC) strategy that will detect how many cores are available on a computer and perform the cleanup using multiple threads in parallel.
Hence if you specified your Java tool to use 4 cores on a node with 48 cores it is not uncommon to see spikes in CPU usage of 32+ cores when the garbage collector kicks in.
When multiple of such Java jobs run on the same node this may result in overloading the node making it very slow and eventually crashing it.
To limit the amount of threads Java should use for GC you can specify -XX:ParallelGCThreads=[integer]. For example:
java -XX:ParallelGCThreads=4 -Xmx4g -jar ${EBROOTMYJAVATOOL}/MyJavaTool.jar
Q: Why are my Java jobs complaining there is ''no space left on device'' when there is plenty of space
A: Some Java tools use a default Java tmp dir in addition to output files/folders you specified explicitly.
This default tmp dir is often on a small, local disk where the OS was installed and hence you may run out of space there while there is plenty of space left on the disk you explicitly specified for your output.
You can change the location of the default tmp dir using -Djava.io.tmpdir=[folder]. For example:
java -Djava.io.tmpdir="/path/to/my/tmp/folder" -jar myJavaTool.jar -i myInputFile -o someOutputFolder
For jobs that generate random IO (as opposed to streaming IO) it is usually a lot more efficient to use the local scratch space on a node as opposed to using a large shared storage system. For example:
java -Djava.io.tmpdir="${TMPDIR}" -jar myJavaTool.jar -i myInputFile -o someOutputFolder
See how to use local scratch space on a cluster node for details.
Q: Why does Git fail with "The requested URL returned error: 403"
A: When you want to use Git and experience an error like this
error: The requested URL returned error: 403 while accessing https://github.com/....
fatal: HTTP request failed
your Git version is too old. In order to use the most recent version of Git installed on the cluster use:
module load git
module list
Q: Why do I get "sbatch: error: Batch job submission failed: Invalid account or account/partition combination specified"
A: Either you don't have a Slurm account or you do have Slurm account, but are not allowed to submit jobs to the specified Quality of Service (QoS) level.
The first time you submit a job, your Slurm account should have been created automatically. You can check this by executing:
sacctmgr show assoc tree format=Cluster,Account,User%-30,Share,QOS%-160,DefaultQOS%-16
If you do not see your account in the list of Slurm users, please contact the helpdesk.
If your Slurm account does exist you most likely tried to submit a job to a QoS level you don't have access to or that does not exist at all.
Check the list of available QoS levels.
Q: Why are my jobs not starting with state pending (PD) and reason QOSMax[some_resource]!PerUser or QOSGrp[some_resource]Limit?
A: You've reached the maximum number of resources running jobs can consume simultaneously in this QoS level:
QOSMax[some_resource]PerUser: limit for all jobs of a single user.
QOSGrp[some_resource]Limit: limit for all jobs of all users.
You may be able to allocate additional resources in another QoS level.