RStudio - How to use a local IDE for R to crunch data in R on Hyperchicken
Introduction
RStudio is an Open Source and free Integrated Development Environment (IDE) for R. This allows you to work in Graphical User Environment (GUI) in addition to a terminal, which makes it easier when working with data interactively especially when working with graphs / plots as you can view them directly. If you work only on the commandline on the cluster, you would have to create a graph/plot there, copy the image file to your local desktop/laptop and then open the image on your local computer to view the image.
Note that there is also a paid commercial version of RStudio with extra bells and whistles, but the free version should suffice to work with R on Hyperchicken.
There are several flavors of RStudio and ways to work with them, but we can only support one of them.
How to NOT use RStudio
Do not run the normal a.k.a. non-server version of RStudio on Hyperchicken sending the graphical (X11) output to your local client computer. Well, it may "work", but the lag in the GUI will result in a very frustrating experience.
Do not run RStudio server on Hyperchicken, which is accessed using your local web browser. This is a security risk due to the weak security implementation in RStudio server. Therefore we will not install the server edition.
How to use RStudio

You can use RStudio by:
- Running the normal a.k.a. desktop a.k.a. non-server version of RStudio on your local computer and
- using the
remoteRR-package to create an R-session on Hyperchicken - off loading the data processing from your local computer to Hyperchicken via the remote R-session created with
remoteR
This setup will ensure:
- The original data sets can stay on Hyperchicken
- Communication between your local client computer and Hyperchicken is encrypted via the SSH protocol.
- Code to crunch data can be written on your local client and will be send to Hyperchicken for analysis of the data sets.
- Result files also stay on Hyperchicken.
Data access policies may differ, but in most cases it is allowed to download aggregate results to your local client. E.g. if you create a bar plot of the median of variable X for different cohorts, this will not contain any data for an individual sample. Using RStudio to look at such a plot would be compatible with such a data access policy.
Note that if you include measurements for individual samples to the plot - e.g. you include outliers and label them with sample IDs - then you may not be allowed to download that to your local computer.
1. Install software on your own computer
-
Install libsodium
- For Linux and Windows computers see the libsodium documentation
- For macOS computers install Homebrew if you do not already have it
and install
libsodiumin a terminal with this commandbrew install libsodium
- Install a set of compilers and standard libraries, so you can compile R packages from source code
- For Linux: consult the documentation of your distro.
- For Windows: install Rtools
- For macOS: install Xcode either from the App store or using the
xcode-select --installcommand in the Terminal.
2. Login on Hyperchicken
Login on Hyperchicken with your SSH client
3. Create a screen or tmux session on Hyperchicken
Optionally start a screen or tmux session.
Working with screen or tmux is beyond the scope of this documentation, but highly recommended.
It allows you to disconnect from Hyperchicken while leaving your session running,
so you can re-login and re-connect later.
Without screen or tmux a dropped network connection will result in loosing the session and loosing any unsaved work in it.
There is a good article How to Use Linux’s screen Command on the How-To Geek website.
Use the -S argument to give your screen session a name. E.g. to create one named rstudio:
screen -S rstudio
4. Create an interactive Slurm session on Hyperchicken
See Crunch - How to manage jobs on Hyperchicken for details.
Simple example requesting a single core and 1 GB RAM memory for max one hour:
srun --cpus-per-task=1 --mem=1gb --nodes=1 --qos=interactive --time=01:00:00 --pty bash -i
5. Load and start R in your interactive Slurm session on Hyperchicken
module load RPlus
R
If you loaded RPlus in the previous step this contains a bare R version
and a large list of R packages including remoteR and its dependencies.
If you prefer to load a bare R installation and manage your own list of R packages you will need to
install the remoteR R-package
and its dependencies in your R session yourself using:
install.packages('sodium')
# Latest release no longer available from CRAN.
#install.packages('remoter')
# Workaround: install latest release from GitHub
install.packages('remotes')
library('remotes')
remotes::install_github('wrathematics/argon2', ref = github_release())
remotes::install_github('RBigData/remoter', ref = github_release())
When you are asked if you would like to install in your own library folder, then answer yes.
6. Start a remoteR server session in your R session on Hyperchicken
Generate a random password to secure your remoteR session and start remoteR in server mode.
library('sodium')
library('remoter')
remoter_session_password <- rawToChar(as.raw(sample(c(65:90,97:122), 10, replace=T)))
message(sprintf('Your password for remoteR is: %s', remoter_session_password))
remoter::server(verbose = TRUE, password = remoter_session_password, secure=TRUE)
The remoteR package will now create a session and report on which machine it is running and which port it selected.
Each session needs its own unique port and remoteR will automatically select one that is free.
You will need this port number and the machine name later on when creating the SSH tunnel...
E.g.:
[2023-05-10 12:05:47]: *** Launching secure server ***
                       Hostname:     gs-vcompute07
                       Port:         55555
Optionally in case you are running this inside screen:
Now press CTRL+a followed by CTRL+d to detach from the screen.
The R session inside the interactive Slurm job inside the screen session will continue to run in the background.
You can reconnect to the existing screen session using -r argument and the name of the screen session.
E.g.:
screen -r rstudio
7. Create an SSH tunnel on your own computer
Now we need to create an SSH tunnel from your local client computer to the server and connect to the remote R session.
For Windows clients
The instructions below we assume you use MobaXterm to connect to Hyperchicken as described in SSH config and login to UI via Jumphost for users on Windows.
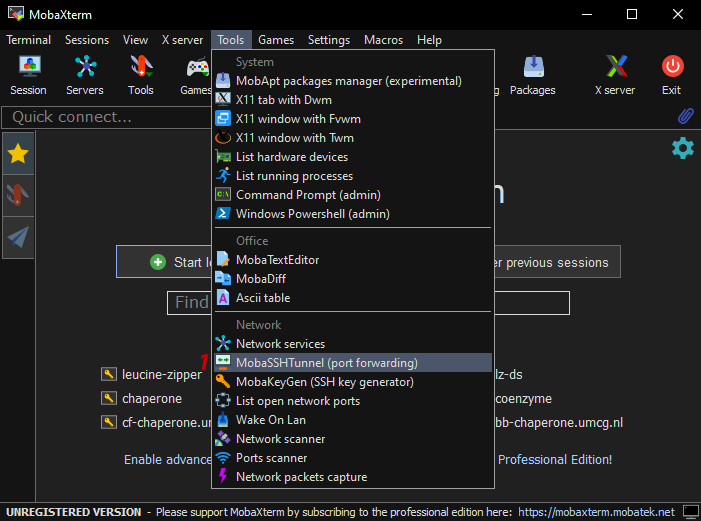
- 1: Select MobaSSHTunnel from the Tools menu.
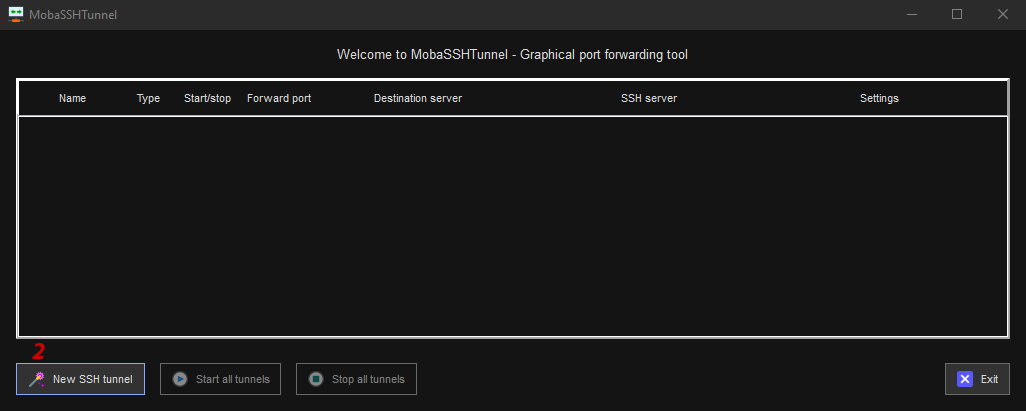
- 2: Click the New SSH tunnel button.
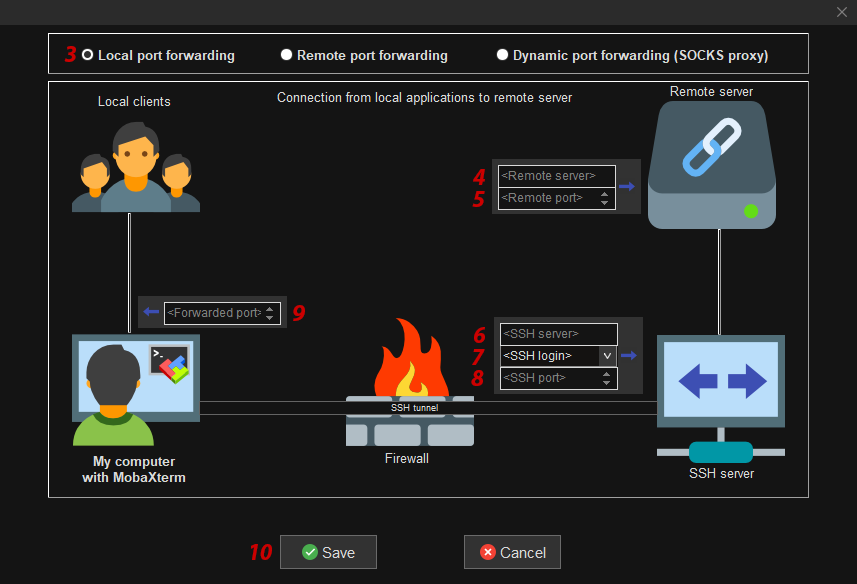
- In the popup window fill in / select:
- 3: Local port forwarding
- 4: Remote server field: The hostname of the compute node where
remoteRis running. - 5: Remote port field: The port number chosen by
remoteRon the server side. - 6: SSH server field: Use jumphost address 45.88.81.146
- 7: SSH login field: Use your account name as you received it by email from the helpdesk.
- 8: SSH port field: 22
- 9: Forwarded port field: The port number you chose on the client side.
For the Forwarded port you have to chose a free port yourself. Hence, it must be a port that is not yet used by another process. We suggest you simply try to use the same number as the one thatremoteRselected on the server side. If that one does not work because it is already taken, simply increment by one and retry until you found one that is free. - 10: Click the Save button.
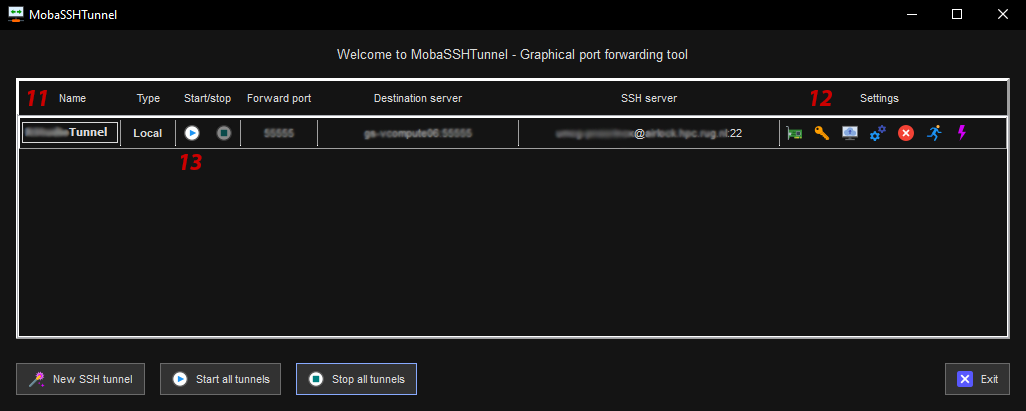
- 11: Give the tunnel config a name.
- 12: Click the key icon to select your private key file.
- 13: Click the play button to start the SSH tunnel.
For Linux & macOS clients
Use the ssh command in a terminal to create an SSH tunnel from your local machine via jumphost portal
to the Hyperchicken compute node on which remoteR is running in your interactive Slurm session.
The general syntax is
ssh -N -L localhost:<port_number_on_client>:localhost:<port_number_on_server> portal+<hostname_of_remoter_server>
The example below uses the same port number on the client side as the one chosen by remoteR on the server side.
ssh -N -L localhost:55555:localhost:55555 airlock+gs-vcompute07
If you get a message like this:
bind [127.0.0.1]:55555: Address already in use
channel_setup_fwd_listener_tcpip: cannot listen to port: 55555
Could not request local forwarding.
then the selected port on the client side is not free and already used by another process. Try the next port number until you find one that is free: in that case you will not get any message.
ssh -N -L localhost:55556:localhost:55555 airlock+gs-vcompute07
8. Install remoteR in RStudio on your own computer
Start RStudio, go to the Console tab and install the sodium and remoteR R-packages with these commands
install.packages('sodium')
# Latest release remoteR no longer available from CRAN.
#install.packages('remoter')
# Workaround: install latest release from GitHub
install.packages('remotes')
library('remotes')
remotes::install_github('wrathematics/argon2', ref = github_release())
remotes::install_github('RBigData/remoter', ref = github_release())
9. Using the remote R session in RStudio on your own computer

In RStudio on your own computer you can now connect to the remote R session using:
library('sodium')
library('remoter')
remoter::client('localhost', port = port_number_on_client, password = '******')
- Replace
port_number_on_clientwith the port number you chose for the SSH tunnel on the client side - Replace
******with the password generated on the server side when starting theremoteRsession.
Creating plots
To make plots you have to call dev.off() after each plot you make.
This is the signal for the remoteR package to send your plot to your local computer.
The default resolution of the plots is quite low. This can be resolved by increasing the width and height before each plot. E.g. something like this
rpng(width = 1000, height = 1000)
An example plot to test the plotting functionality can be created with
rpng(width = 1000, height = 1000)
dat<- data.frame(t=seq(0, 2*pi, by=0.1) )
xhrt <- function(t) 16*sin(t)^3
yhrt <- function(t) 13*cos(t)-5*cos(2*t)-2*cos(3*t)-cos(4*t)
dat$y=yhrt(dat$t)
dat$x=xhrt(dat$t)
with(dat, plot(x,y, type="l"))
with(dat, polygon(x,y, col="hotpink"))
points(c(10,-10, -15, 15), c(-10, -10, 10, 10), pch=169, font=5)
dev.off()
10. Cleaning up
Don’t keep R running forever on Hyperchicken! Make sure to really exit your session on Hyperchicken when you are done to prevent wasting resources, which is not nice for others waiting in the queue.
- Without
screen:
Useq()to quit theRsession, typeexitorCTRL+xto exit your interactive Slurm job. - With
screen:
First re-attach to your screen session if you were detached. Next, useq()to quit theRsession, typeexitorCTRL+xto exitscreenand anotherexitorCTRL+xto exit your interactive Slurm job.